Knowing Where to Draw the Line
1. Look at the table of values, below, of a certain linear function.
x | -1 | 1 | 3 | 5 | 7 |
y | 3 | 8 | 13 | 18 | 23 |
(a) Find the gradient of the line represented in the table and, hence, find the y – intercept of the function
as well.
(b) Now write the equation of the line.
2. (a) Find the gradient of the line between the points (3, -5) and (4, 2).
(b) Next, using one of the points and the gradient that you have, find the y-intercept of the linear function described by the points in part (a).
(c) Now that you have the y-intercept, write the equation of the line described by the points in part (a).
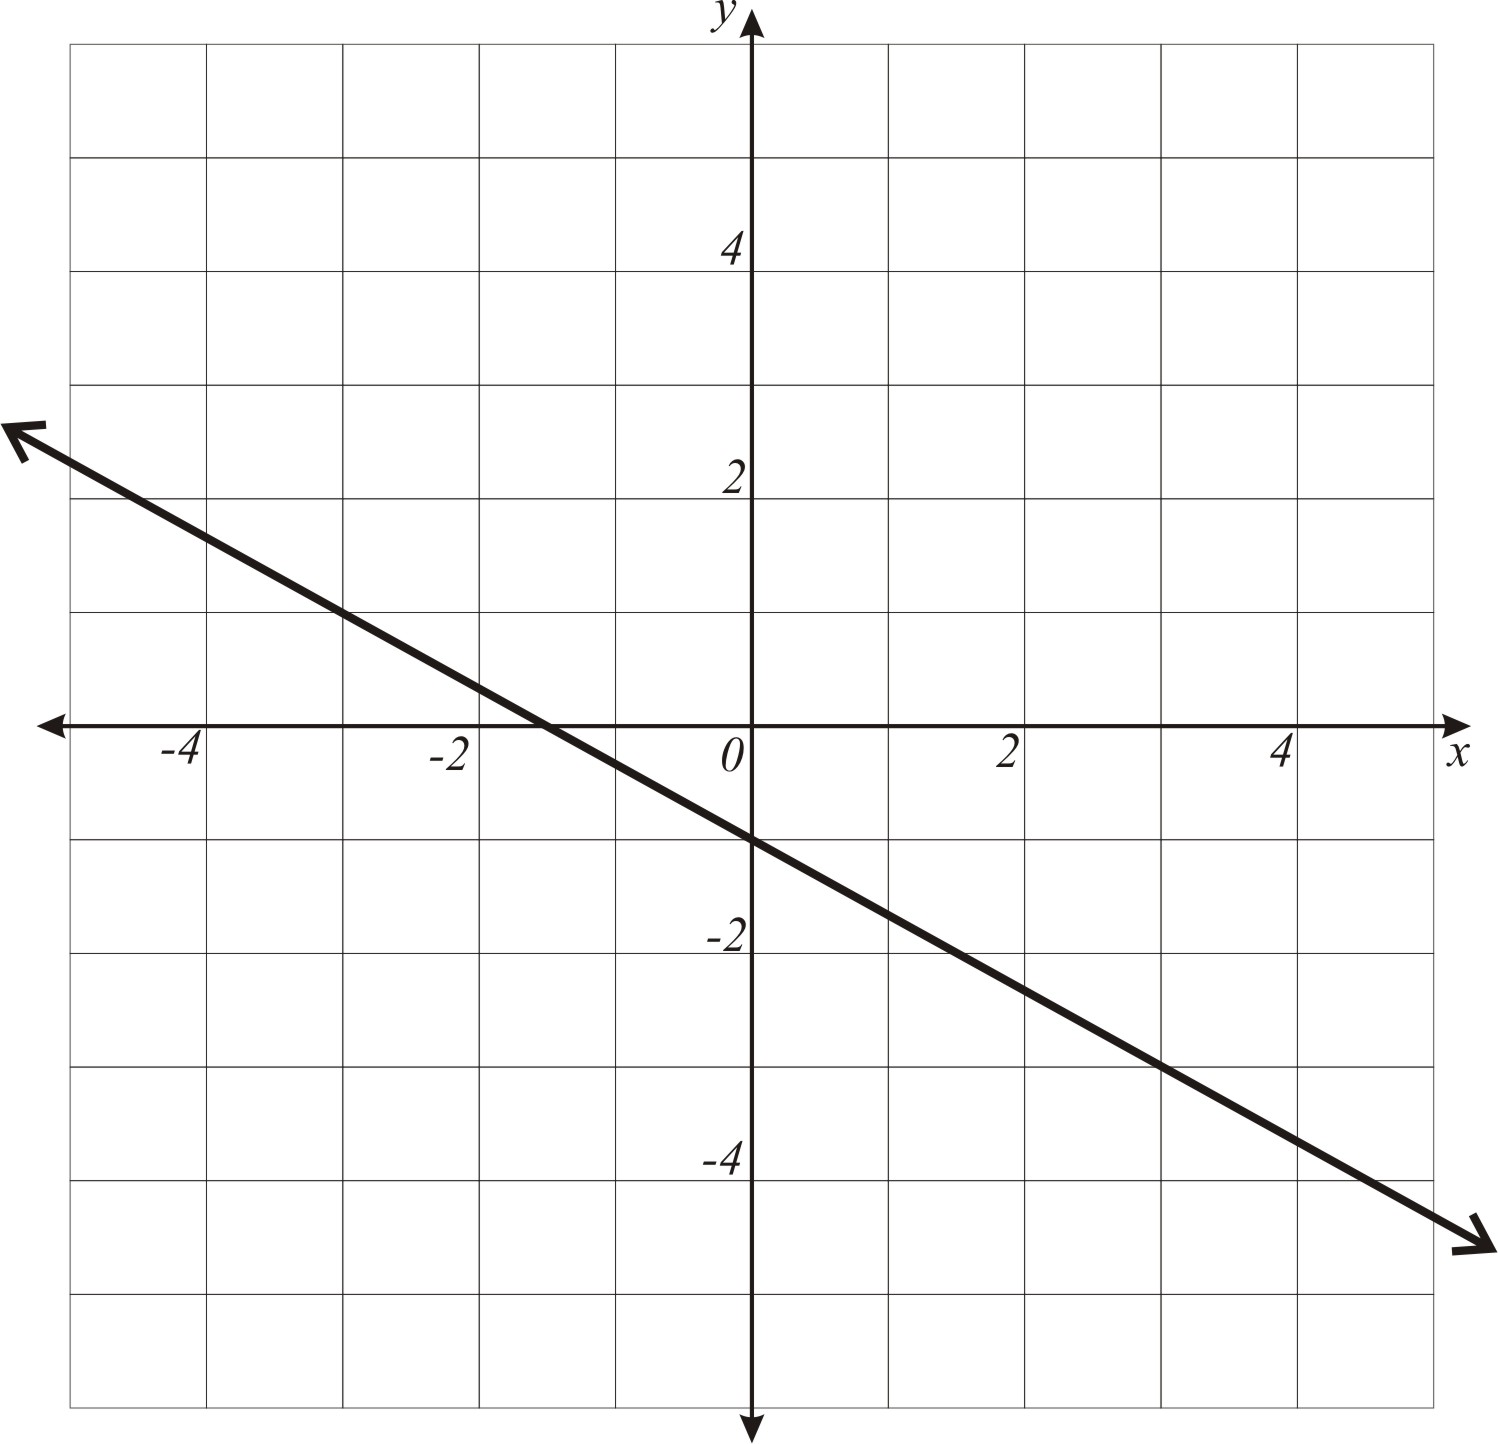
3. By using only the graph of the linear function below, write the equation of the function.
my nets working:). and i wanted to ask that today in the quiz in q 3 or 4 . the one were we had to find which formula goes with the table given i fully expected it to be part c( y=x(-4)+3) but instead it was part b which was a fractions one. can u explain how
ReplyDeletehey yi thought it was c too! how do u know it was b? -_-
ReplyDeleteI don't have the quiz in front of me as I answer this query of yours but it was the option in which the rate of change was -4/3 and there was a non-zero y-intercept. You see, as the y values are decreasing by 4 each time x is decreasing by 3. so the rate is -4 per 3, which is -4/3.
ReplyDeleteoh! i get it now. thanks for explaining
ReplyDelete